Industry collaboration · 2025–2026
Market Research Dashboard
A market analysis platform built to be honest about what it cannot know — and audited until it was.
The industrial problem
Financial markets are noisy, non-stationary and adversarial: patterns that held last year quietly stop working, and a model that looks brilliant in a naive backtest can be worthless — or ruinous — live. Most retail tools quietly manufacture their own track record, filling signals on the same bar’s close, showing in-sample results as returns, and never keeping score of their own predictions.
So the real engineering problem is not finding alpha. It is building a system whose failures are visible: one that separates what it measured from what it assumed, refuses to backtest quantities it has no point-in-time history for, and keeps a permanent record of its own calls so a later auditor — including its author — can grade it.
The system
Nifty 50 live dashboard
The entry point: live index level, technical indicators computed server-side over two years of daily data, and a dual-horizon read that is kept deliberately separate — a short-term signal and a long-term signal are different questions and are never blended into one number.
- Historical performance — price, forecast band, EMA, RSI, MACD, volume
- Today’s movement — intraday, line or candle
- Technical indicators computed server-side (2Y daily)
- Strategy lab guide
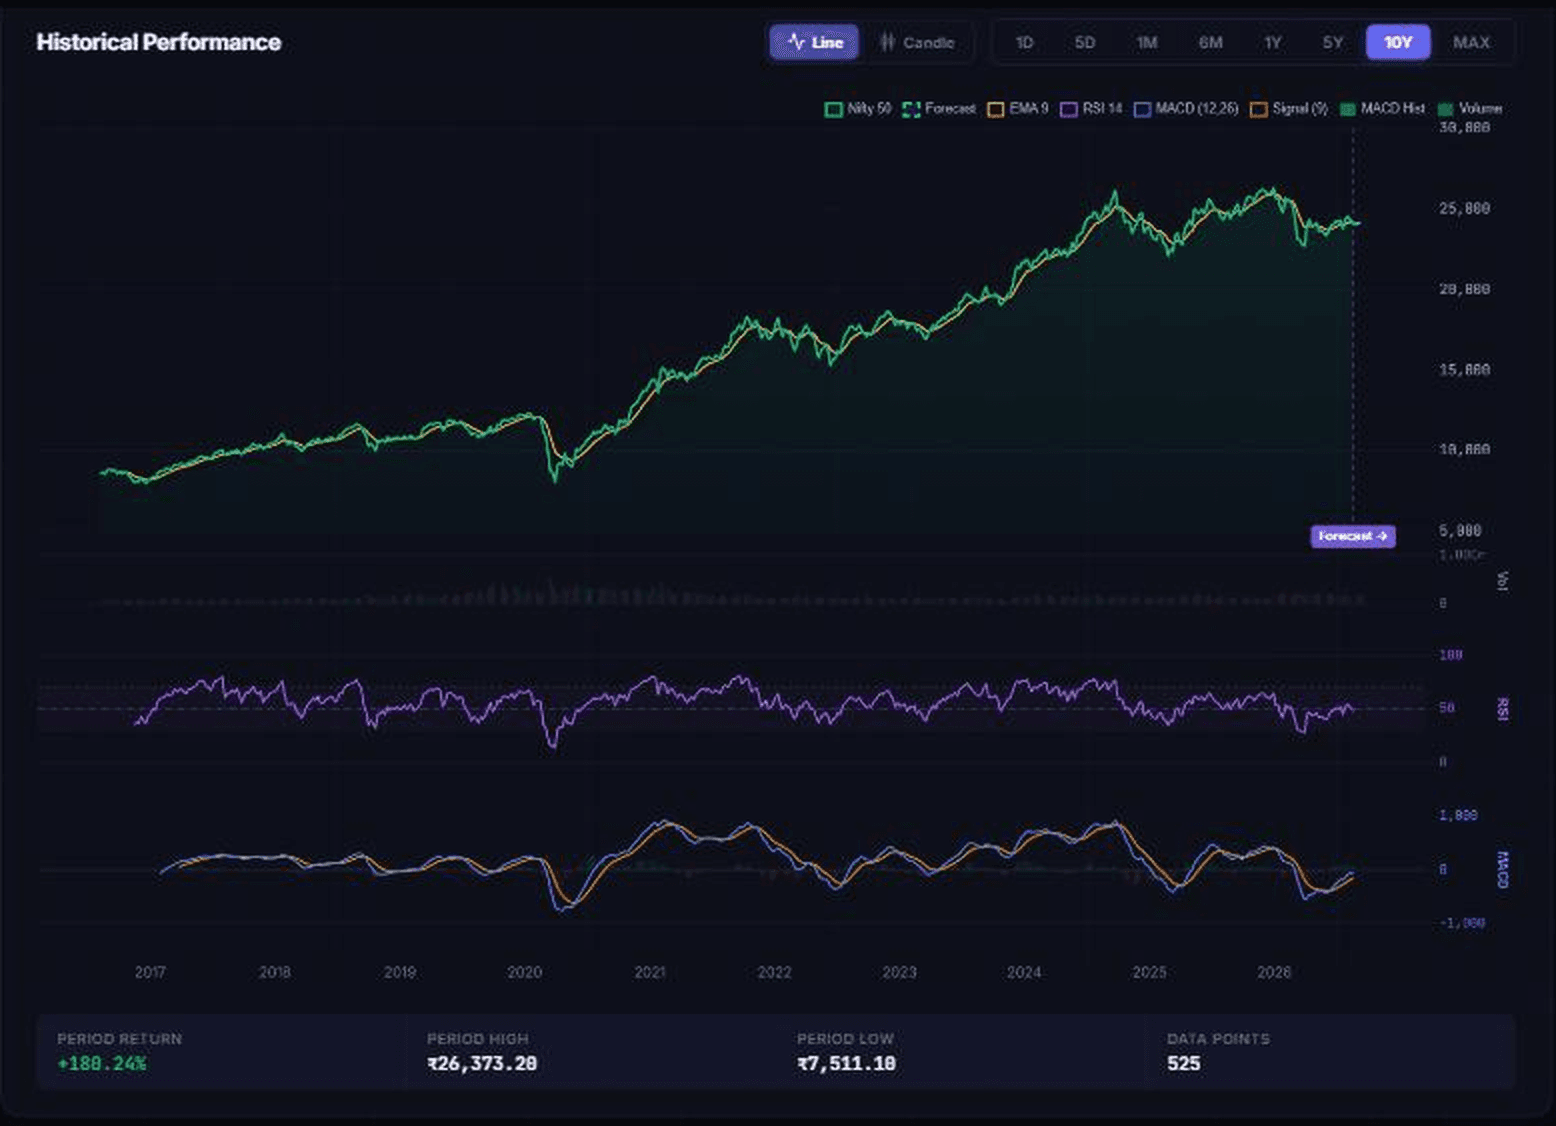
Research and educational system. Not investment advice, and no performance claim is made for it. Captures are of the platform running on local data.
How it was built
- 01
Build the pipeline, then attack it
Live ingestion, feature engineering, model training and a multi-page dashboard were built first — and then audited line by line against one question: if this were my own life savings, would I trust these recommendations? Several findings were structural, not cosmetic, and each one was fixed rather than hidden.
- 02
Refuse to fake a track record
Signals computed on one bar’s close are filled at the next bar’s open with per-side transaction costs. Models train on the first 60% of history and trade only the remainder, with feature scaling fitted on the training window alone. During the training window the strategies emit flat — no in-sample result is ever displayed as a return.
- 03
Keep receipts
Every scan writes to a prediction journal that an automatic grader scores later. Quantities with no point-in-time history — analyst targets, forward estimates — are excluded from hit-rate calculations, and every payload states that it excluded them.
What this builds on
- Research and educational system
- Built as an engineering and research exercise in honest evaluation. It is not investment advice, and no performance claim is made for it.
Archive: chopra_collab_new/nifty-dashboard